Windows Server 2012 brings some great improvements to Virtualization. We’re currently running it in production and it works wonders, especially with the new Hyper-V Replica feature which is great and free way of implementing DR. So now you’ve got that cluster running, how can we tell if it is performing well. I recently stumbled upon PAL or Performance Analysis of Logs Tool, which is freely available from http://pal.codeplex.com/. The tool comes with a Performance Monitor Template file that we can use to easily record the performance of a Hyper-V 2012 Server and get some visibility into our Servers.

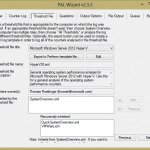
When it comes to Performance things we would want to look at would be Disk Performance, Memory and CPU but understanding what effect these have on Hyper-V isn’t always straightforward, thankfully PAL helps us being making it easy and straightforward. So first off go and download it from codplex and install it onto your workstation on desktop PC (not on your Hyper-V Host). Once installed, open it up. We need to get our Perfmon template so go into the Threshold File tab and select “Microsoft Windows Server 2012 Hyper-V” from the Threshold file title, then choose Export to Perfmon template file. Get this onto your Hyper-V Host and open up Performance Monitor on the host we want to watch.
Open up Performance Monitor on our Hyper-V Host and open up Data Collector Sets, right click on User Defined and select New Data Collector Set. We can call it Hyper-V Performance Counter Set or what every you wish, keep Create from a template (Recommended) selected. Click next and then browse, selecting the XML Template file that we exporter earlier from PAL. Once you finish the wizard it will show up under the User Defined Data Collector Sets. You can now open up the properties and set it to run from 30 minutes to 1 hour depending on what you’re after. It is best to run this during peak load times (so business hours).
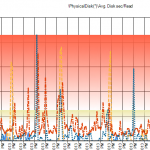
 Now that you’ve collected the data you want to browse to it and copy the .blg file to your workstation (or where ever you installed PAL). Back to PAL, select the log file under the Counter Log tab, then move onto the Questions Tab where you need to specify things such as processors, total RAM, drive configuration to help specify thresholds for your performance report. Navigate to the other tabs if you wish to modify anything else and finally execute the report, this can be time consuming depending on how long you’ve captured performance data for (it took me around 20 minutes for a 1 hour capture). Once it has completed generating the report it opens up in your web browser. Key things to look at are disk latency (as per the graph with RED being critical), memory and CPU issues.
That is a free and easy way to check on the health and performance of your new Hyper-V 2012 Cluster. You can also use PAL for a Windows Server 2008 R2 Hyper-V Cluster and other services such as Exchange or SQL Server, you just need to select the right template.
Share this post with others:

